
When you buy a corporate bond, you’re not just lending money to a company-you’re betting on its ability to pay you back. But how do you know if that bet is worth the risk? The answer lies in three key metrics: credit spread, leverage ratios, and coverage ratios. These aren’t just numbers on a screen. They’re the real language of corporate bond research. Ignore them, and you’re flying blind. Understand them, and you start seeing which bonds are truly safe-and which are ticking time bombs.
What Credit Spread Really Tells You
Let’s start with credit spread. It’s the difference between what a corporate bond pays and what a U.S. Treasury bond of the same maturity pays. Simple, right? Not quite. A 150-basis-point spread doesn’t mean the company is 1.5% more likely to default. That’s the myth most beginners fall for.
The truth? Credit spread is a mix of three things: expected default risk, liquidity risk, and tax effects. For investment-grade companies like Coca-Cola or Johnson & Johnson, liquidity matters more than default risk. A 2010 Bank of Canada study found that 63% of the spread for these firms comes from how hard it is to buy or sell the bond quickly-not from fear they’ll go bust. But for a junk-rated company like a struggling retailer or a highly leveraged energy firm? Default risk dominates. Their spread is mostly about whether they’ll survive the next recession.
And here’s where it gets messy. If you just compare the yield of a 5-year corporate bond to a 5-year Treasury, you’re making a mistake. Coupon payments, call options, and convexity differences can throw your numbers off by 20-30 basis points. That’s a big deal when spreads are only 100-200 bps wide. Professional investors use tools like Z-spread (zero-volatility spread) or OAS (option-adjusted spread) to fix this. But you don’t need Bloomberg or Refinitiv to start. Just know this: if a bond’s spread looks too good to be true, it probably is. Check the maturity, the coupon, and whether it’s callable.
Spreads widen during crises. In 2008, high-yield spreads blew out past 2,000 bps. In March 2020, they jumped 500 bps in a week. But in 2023, they were near 5-year lows. That doesn’t mean companies are safer-it means investors are chasing yield in a high-rate world. A narrow spread can be a warning sign, not a green light.
Leverage Ratios: How Much Debt Is Too Much?
Now let’s talk leverage. This is where you ask: how much debt is this company carrying compared to its ability to generate cash? The two most common ratios are Net Debt to EBITDA and Total Debt to Equity.
Net Debt to EBITDA is the gold standard. You take the company’s total debt, subtract cash and equivalents, then divide by EBITDA (earnings before interest, taxes, depreciation, and amortization). Why EBITDA? Because it strips out accounting and financing choices, giving you a cleaner look at operational cash flow.
For investment-grade companies, a Net Debt to EBITDA under 3.0x is considered healthy. Between 3.0x and 5.0x? Watch closely. Above 5.0x? You’re in risky territory. Think of it like a mortgage. If your income is $100,000 and your debt is $500,000, you’re stretched thin. Same logic applies to corporations.
But here’s the catch: leverage ratios vary by industry. A utility company might carry 6.0x debt and be fine because it has steady, regulated cash flows. A tech startup? 2.0x might be a red flag. Always compare companies within the same sector. A 4.5x ratio might be normal for an oil driller but deadly for a software firm.
And don’t just look at one number. Track it over time. Is leverage rising? Are they issuing more debt to pay dividends or buy back stock? That’s a red flag. Companies that grow debt faster than earnings are one downturn away from trouble.
Coverage Ratios: Can They Even Pay the Interest?
Leverage tells you how much debt a company has. Coverage ratios tell you if it can actually pay the interest on that debt. The two most important ones are Interest Coverage Ratio and EBITDA Coverage Ratio.
Interest Coverage Ratio = EBITDA / Interest Expense. Simple. If a company has $1 billion in EBITDA and $200 million in interest payments, its coverage ratio is 5.0x. That means it earns five times more than it needs to cover interest. Safe. If it’s below 2.0x? That’s dangerous territory. Below 1.5x? They’re barely keeping up. In 2023, over 12% of U.S. high-yield issuers had coverage ratios under 1.5x-meaning they couldn’t pay interest without dipping into cash reserves or selling assets.
EBITDA Coverage Ratio is even broader. It includes lease payments and preferred dividends. Formula: (EBITDA + Lease Payments) / (Interest + Lease Payments + Preferred Dividends). This is especially useful for companies with heavy leasing, like airlines or retail chains.
Here’s a real example: In 2022, a major U.S. airline had an EBITDA of $4.2 billion and interest expenses of $980 million. That’s a 4.3x coverage ratio. Healthy. But if oil prices spike and ticket sales drop? That ratio could fall to 1.8x in a year. That’s the difference between survival and bankruptcy.
Don’t just look at the ratio. Look at the trend. Is coverage improving or deteriorating? Is the company refinancing debt at higher rates? Are they cutting capex to boost EBITDA? Those are signs of stress disguised as efficiency.
Putting It All Together: The Three-Legged Stool
Here’s the truth: no single metric tells the whole story. You need all three.
Imagine two companies:
- Company A: 2.5x Net Debt/EBITDA, 6.0x Interest Coverage, 120-basis-point spread
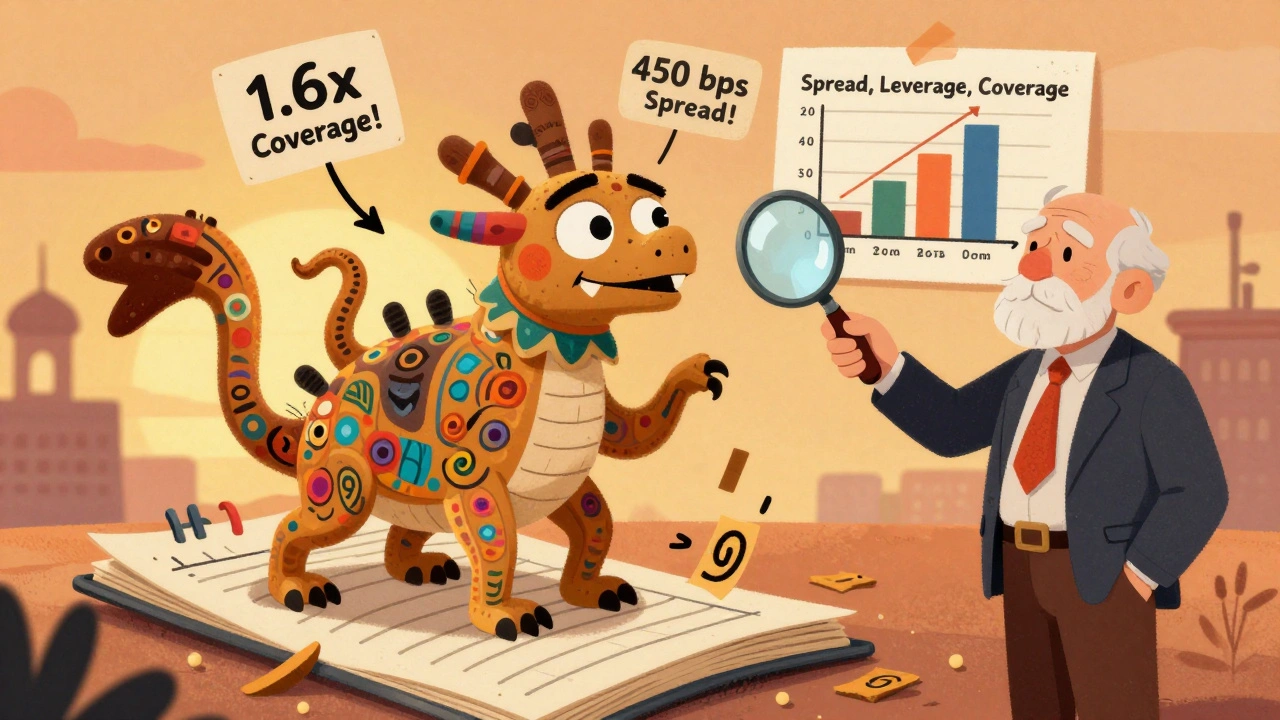
- Company B: 5.8x Net Debt/EBITDA, 1.6x Interest Coverage, 450-basis-point spread
Company A looks safer. But what if that 120-basis-point spread is mostly liquidity? What if the company is in a dying industry with declining EBITDA? What if its debt matures in 2026, and rates are still high?
Company B looks scary. But what if it’s in a cyclical industry like construction, and EBITDA is expected to double next year? What if the high spread is just fear, not reality?
The real skill isn’t in reading numbers-it’s in reading context. Use spread to gauge market sentiment. Use leverage to judge structural risk. Use coverage to test survival under stress. Together, they form a complete picture.
What You’re Not Being Told
Most retail investors think corporate bonds are “safer than stocks.” That’s true-on paper. But in 2022, over $120 billion in U.S. corporate bonds defaulted. That’s more than in any year since 2009. Most of those were rated BBB-the lowest investment-grade tier. They weren’t junk. They were “safe.” Until they weren’t.
Here’s the dirty secret: credit ratings lag. Moody’s and S&P don’t downgrade a company until it’s already in trouble. By then, the bond price has already crashed. That’s why you need your own analysis. Don’t rely on ratings. Use spreads, leverage, and coverage to get ahead of the downgrade.
Also, watch for ESG factors. A 2023 Bank of Canada study found that ESG ratings now explain 18-22% of spread variation for investment-grade bonds. A company with poor environmental practices or weak governance might be paying a higher spread-not because it’s financially weak, but because investors are avoiding it. That’s a new layer of risk you can’t ignore anymore.

How to Start Analyzing Corporate Bonds Today
You don’t need a $30,000 Bloomberg terminal. Here’s how to begin:
- Find a corporate bond you’re interested in. Use FINRA’s Bond Center or your brokerage’s bond screener.
- Check the yield and compare it to the Treasury of the same maturity. Calculate the spread in basis points.
- Look up the company’s latest 10-K or 10-Q filing. Find Net Debt and EBITDA. Calculate Net Debt/EBITDA.
- Find Interest Expense and calculate Interest Coverage Ratio.
- Compare all three metrics to industry peers. Is the spread unusually high? Is leverage rising? Is coverage falling?
If you’re still unsure, start with bonds from companies you know: Apple, Microsoft, Walmart. They have strong financials, transparent reporting, and reliable data. Once you get comfortable, move to riskier names.
What to Avoid
- Don’t chase high yields without checking coverage. A 9% yield on a bond with 1.2x coverage is a trap.
- Don’t assume a narrow spread means safety. In 2023, tight spreads reflected investor desperation, not strong credit.
- Don’t ignore callable bonds. If the company can redeem the bond early, your yield calculation is wrong unless you use OAS.
- Don’t use Treasury yields as benchmarks for floating-rate bonds. Use LIBOR or SOFR curves instead.
Corporate bonds aren’t boring. They’re complex, dynamic, and full of hidden risks. But with the right tools, you can cut through the noise and find real value.
What is a good credit spread for corporate bonds?
There’s no single “good” spread-it depends on credit quality and market conditions. For investment-grade bonds, 50-150 basis points is typical in stable markets. For high-yield bonds, 300-800 bps is common. But a low spread in a rising rate environment can signal overvaluation, while a high spread might reflect temporary panic. Always compare to industry averages and historical norms.
Is a higher leverage ratio always bad?
Not always. Leverage is normal in capital-intensive industries like utilities, telecom, or infrastructure. A utility with 6.0x Net Debt/EBITDA might be perfectly fine if it has predictable cash flows and regulated returns. But for tech or consumer companies, even 3.5x could be risky. Context matters more than the number.
How do coverage ratios predict bond defaults?
Coverage ratios are leading indicators. Companies with Interest Coverage below 1.5x are 5x more likely to default within 12 months than those above 3.0x, according to Moody’s 2023 analysis. A falling coverage ratio-even if still above 2.0x-often precedes a credit downgrade. Watch for three consecutive quarters of declining coverage.
Can I rely on bond ratings from S&P or Moody’s?
Ratings are a starting point, not an endpoint. They’re backward-looking and often slow to react. In 2022, over 60% of corporate bond defaults were from issuers still rated BBB or higher at the time of default. Use ratings to filter, but never to decide. Always do your own analysis with spreads, leverage, and coverage ratios.
What’s the difference between G-spread and Z-spread?
G-spread is the simple difference between a corporate bond’s yield and a Treasury bond’s yield of the same maturity. Z-spread (zero-volatility spread) accounts for the entire yield curve, not just one point. It’s more accurate because it matches each cash flow to its corresponding spot rate. Z-spread is preferred for bonds with irregular payments or embedded options like call features.
Next Steps: Where to Go From Here
Start small. Pick one bond from a company you understand. Run the numbers. Compare it to two others in the same industry. See how the spreads, leverage, and coverage differ. You’ll start noticing patterns. You’ll see why one bond trades at a premium and another is discounted. That’s the power of real bond research.
Don’t wait for a crash to learn. The best time to understand corporate bonds is when the market is calm. That’s when you can build your skills without pressure. When the next downturn hits, you won’t be guessing. You’ll be analyzing.
John Weninger
December 10, 2025 AT 05:06I’ve been digging into corporate bonds for about a year now, and this post nailed it. I used to think spreads were just about default risk-turns out, I was totally missing the liquidity piece. Found out my favorite utility bond had a 90-basis-point spread, but 70% of that was just because it traded like once a month. Now I check trading volume before I even look at the yield. Huge eye-opener.
Also, the ESG bit? Real. I passed on a BBB-rated telecom bond last year because of their water usage scandal, even though the coverage ratio was 4.1x. Turns out, the spread widened 40 bps over three months just from ESG outflows. Didn’t lose money, but I learned that ESG isn’t just feel-good noise-it’s pricing now.
Omar Lopez
December 11, 2025 AT 19:30There is a critical oversight in your exposition regarding the Z-spread versus G-spread distinction. The Z-spread, while theoretically superior, assumes a flat volatility surface and is therefore inappropriate for bonds with embedded options unless calibrated via Monte Carlo simulation under a term structure model. The OAS, by contrast, explicitly accounts for optionality and is the only metric that permits meaningful cross-sectional comparison among callable or putable issues. Your recommendation to use Z-spread without qualification is misleading and potentially dangerous for retail investors who lack access to computational tools.
Furthermore, your assertion that ESG explains 18–22% of spread variation is statistically dubious without controlling for issuer size, sector, and liquidity premium. The Bank of Canada study you cite employs a fixed-effects panel model-but you omit that the sample was restricted to investment-grade issuers with >$1B market cap, rendering generalization invalid.
Jonathan Turner
December 12, 2025 AT 20:36Oh wow, someone actually wrote a 2,000-word essay on bonds and didn’t mention that the Fed’s balance sheet is what’s keeping spreads artificially tight? No wonder you think 120 bps is ‘safe.’
Let me guess-you think Apple’s bond is ‘solid’ because it’s ‘Apple.’ Bro, they’ve got $100B in cash and are borrowing at 4% to buy back stock so their execs can cash out. That’s not investing, that’s corporate theater.
And don’t get me started on ESG. You think some CSR report is gonna save you when the bond’s down to 60 cents on the dollar? In 2008, every ‘responsible’ bank had a ‘sustainability committee.’ Guess what happened then? You don’t hedge with virtue. You hedge with leverage ratios and coverage. Everything else is woke noise.
And yeah, I know you’re gonna say ‘but what about the airline example?’ I’ve got 30 years in this game. That airline’s debt is garbage because they’re still flying 737s with 1990s engines. They’re not ‘cyclical’-they’re obsolete. And you’re still reading 10-Ks like it’s 2012? Get on Bloomberg or GTFO.
Geoffrey Trent
December 14, 2025 AT 10:49Just read the first paragraph and skipped to the end. If you’re still using EBITDA as a proxy for cash flow, you’re doing it wrong. Depreciation’s not real? Cool. Then why do I pay taxes on it? Anyway, I bought a bond last year with a 7% yield and 1.3x coverage. It defaulted in 4 months. Lesson learned: if the number looks too good to be true, it’s a trap. Don’t overthink it. Just don’t buy junk.